Unfortunately, the solutions are fairly easy but it would be political suicide for anyone who would even dare to actually propose anything that would ruffle the feathers of the vested interests, the powerful or (God forbid /s) the wealthiest 10%, or the “untouchable” 0.1%.
Simplify/Regularize the tax code by eliminating all ambiguity :
- by removing exceptions and loopholes for corporation and individuals (it only helps the wealthy with “top gun” accountants to “legally” avoid/reduce taxes).
- pre-filled tax declaration should be expanded or made automatic for every individuals with simple tax situations (they should not be worrying about taxes and tax credits when their income in lower than a inflation indexed preset treshold)
- make everyone’s tax information public or accessible for every citizens similar to Tax transparency in Finland (PDF) it helps prevent/detect/reduce social inequalities and keep every one accountable toward each others
- exclude tax filling softwares and companies whom have vested interest in making tax declarations as complex and as unintelligible as possible by lobbying government
- increase the progressive taxe rate for higher income brackets, add new higher brackets (over 60%) for yearly income over a million, over tens of millions, over hundreds of millions, etc…
- eliminate Religious Tax Exemptions as they have been [abused and misappropriated more often without any real public oversight] (https://centreforinquiry.ca/religious-institutions-and-your-tax-dollars/)
- increase financing and auditing of Canada Revenue Agency to help better pursue, prosecute and recover wealth hidden in tax Havens, or create a new separate branch of the CRA tasked exclusively to handle corporate tax shenanigans/evasion and deep pocketed individuals
This is a partial, but relevant, copy of one of my previous post (check my post history for the original long post).
spoiler

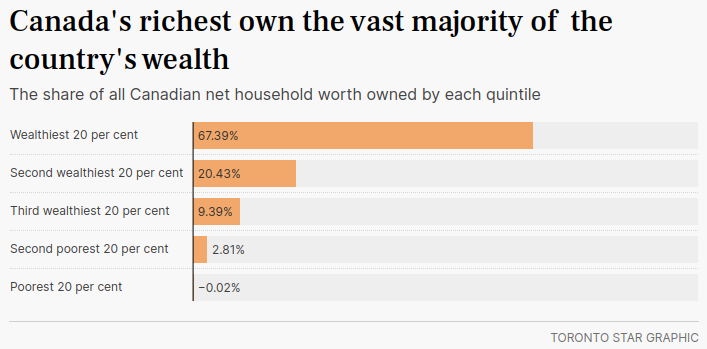
I feel like this chart tells a pretty clear story about where all our affordability issues are coming from.
I also suspect if the top quintile were separated out into it’s own graph of this nature, it would probably have a similar look where the majority of the wealth held by that 20% is held by the top few percent of the group.
Just for personal reference, do you know when the statistics for this graphic were collected?
According to the article it’s Q3 2023. From what I can tell the data is drawn from here, which is sourced from the National Balance Sheet Accounts which are updated quarterly.
Thank you


